> ## Documentation Index
> Fetch the complete documentation index at: https://graphite-58cc94ce.mintlify.site/docs/llms.txt
> Use this file to discover all available pages before exploring further.
# Review comments
> Understanding Graphite Agent's feedback and how to get the most value from it
## How Graphite Agent provides feedback
When Graphite Agent identifies an issue in a pull request, it adds a comment directly on the relevant lines of code. Each comment includes:
1. A clear description of the problem
2. An explanation of why it matters
3. A concrete suggestion for how to fix it
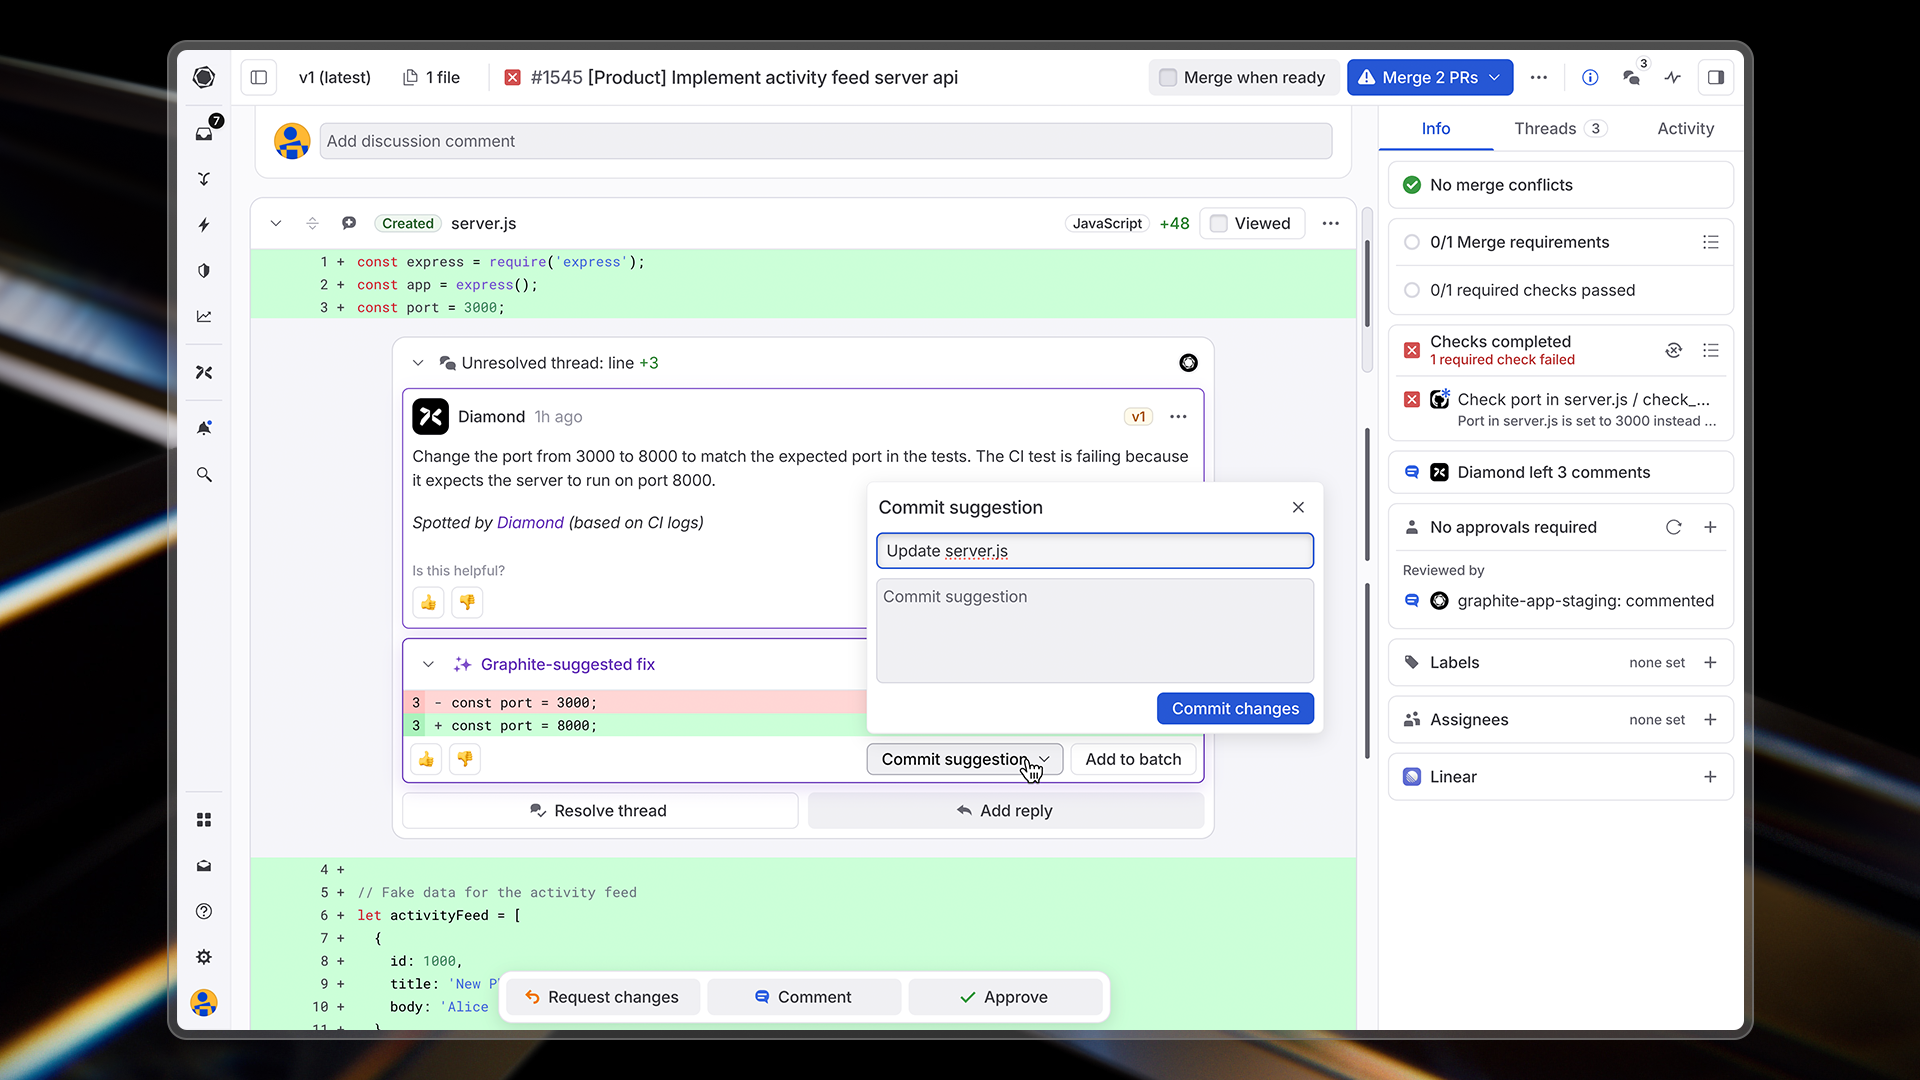 You can see Graphite Agent's comments, suggestions, and choose to commit suggestions — just like your teammates'.
## Types of issues Graphite Agent identifies
Graphite Agent catches a wide range of issues that often slip through manual code review and testing:
### Logic bugs
Graphite Agent identifies when your implementation doesn't match the intended behavior, detecting issues like:
* Functions that don't accomplish what they're named to do
* Inconsistencies between code behavior and documentation
* Mismatches between API usage and implementation
* Off-by-one errors and incorrect loop boundaries
### Edge cases
Graphite Agent finds potential failure modes that aren't handled in your code:
* Missing null checks or error handling
* Race conditions in asynchronous code
* Memory leaks and resource management issues
* Unexpected side effects
### Security vulnerabilities
Graphite Agent spots security issues before they reach production:
* SQL injection vulnerabilities
* Cross-site scripting (XSS) opportunities
* Authorization bypass possibilities
* Insecure cryptographic practices
### Performance issues
Graphite Agent detects code that might cause performance problems:
* Inefficient algorithms or data structures
* Unnecessary API calls or database queries
* Memory-intensive operations that could be optimized
* N+1 query patterns
### Accidentally committed code
Graphite Agent catches code that was likely not meant to be committed:
* Debug statements and console logs
* Test data and development configurations
* Commented-out code blocks
* Temporary workarounds
## Tracking AI review impact
You can monitor AI review activity and impact from the [AI code review dashboard](https://app.graphite.com/ai-reviews). The dashboard is organized into tabs for easy navigation:
### Overview tab
The **Overview** tab provides time-series metrics to help you understand your AI reviewer's performance:
You can see Graphite Agent's comments, suggestions, and choose to commit suggestions — just like your teammates'.
## Types of issues Graphite Agent identifies
Graphite Agent catches a wide range of issues that often slip through manual code review and testing:
### Logic bugs
Graphite Agent identifies when your implementation doesn't match the intended behavior, detecting issues like:
* Functions that don't accomplish what they're named to do
* Inconsistencies between code behavior and documentation
* Mismatches between API usage and implementation
* Off-by-one errors and incorrect loop boundaries
### Edge cases
Graphite Agent finds potential failure modes that aren't handled in your code:
* Missing null checks or error handling
* Race conditions in asynchronous code
* Memory leaks and resource management issues
* Unexpected side effects
### Security vulnerabilities
Graphite Agent spots security issues before they reach production:
* SQL injection vulnerabilities
* Cross-site scripting (XSS) opportunities
* Authorization bypass possibilities
* Insecure cryptographic practices
### Performance issues
Graphite Agent detects code that might cause performance problems:
* Inefficient algorithms or data structures
* Unnecessary API calls or database queries
* Memory-intensive operations that could be optimized
* N+1 query patterns
### Accidentally committed code
Graphite Agent catches code that was likely not meant to be committed:
* Debug statements and console logs
* Test data and development configurations
* Commented-out code blocks
* Temporary workarounds
## Tracking AI review impact
You can monitor AI review activity and impact from the [AI code review dashboard](https://app.graphite.com/ai-reviews). The dashboard is organized into tabs for easy navigation:
### Overview tab
The **Overview** tab provides time-series metrics to help you understand your AI reviewer's performance:
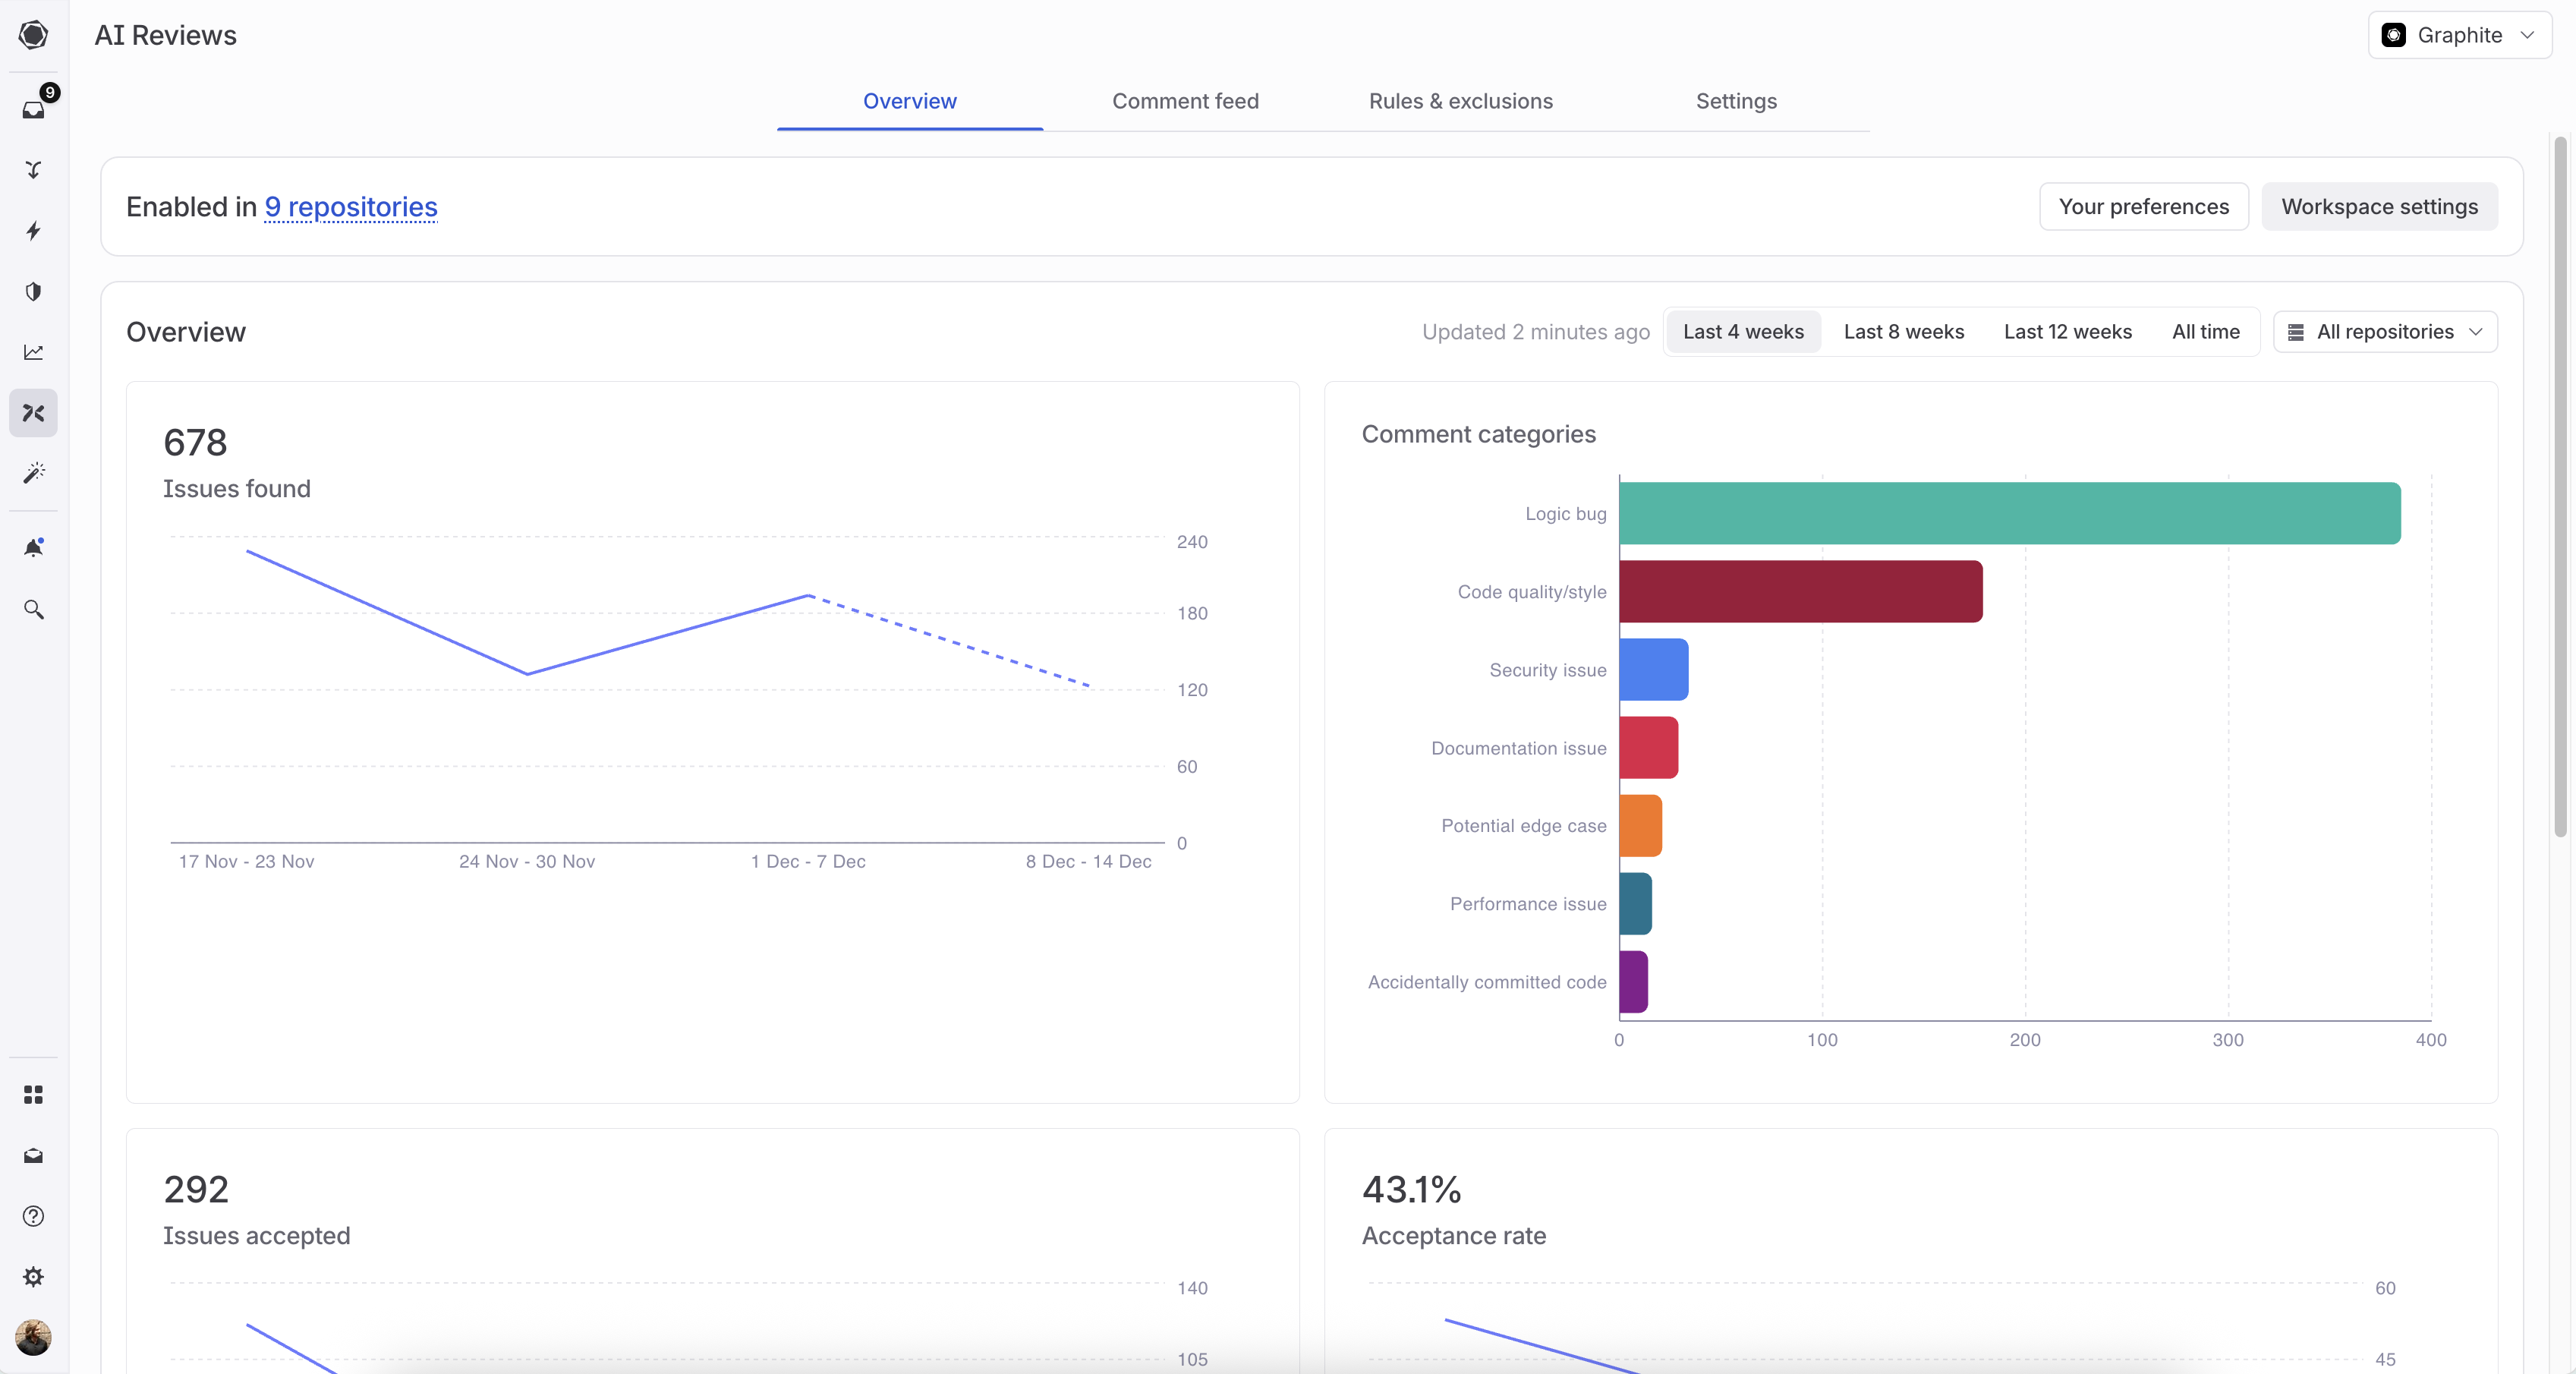 * **Issues found**: Total issues identified, with a breakdown by category
* **Issues accepted**: Number of issues that led to code changes
* **Acceptance rate**: Percentage of suggestions that were accepted over time
* **PRs reviewed**: Volume of pull requests analyzed
* **Downvote rate**: Feedback tracking to identify areas for improvement
You can filter these metrics by:
* **Time period**: Last 4 weeks, 8 weeks, 12 weeks, or all time
* **Repository**: View metrics for specific repositories or across all repos
The category breakdown shows counts and acceptance rates for each issue type (logic bugs, security issues, edge cases, etc.), helping you understand where your reviewer adds the most value.
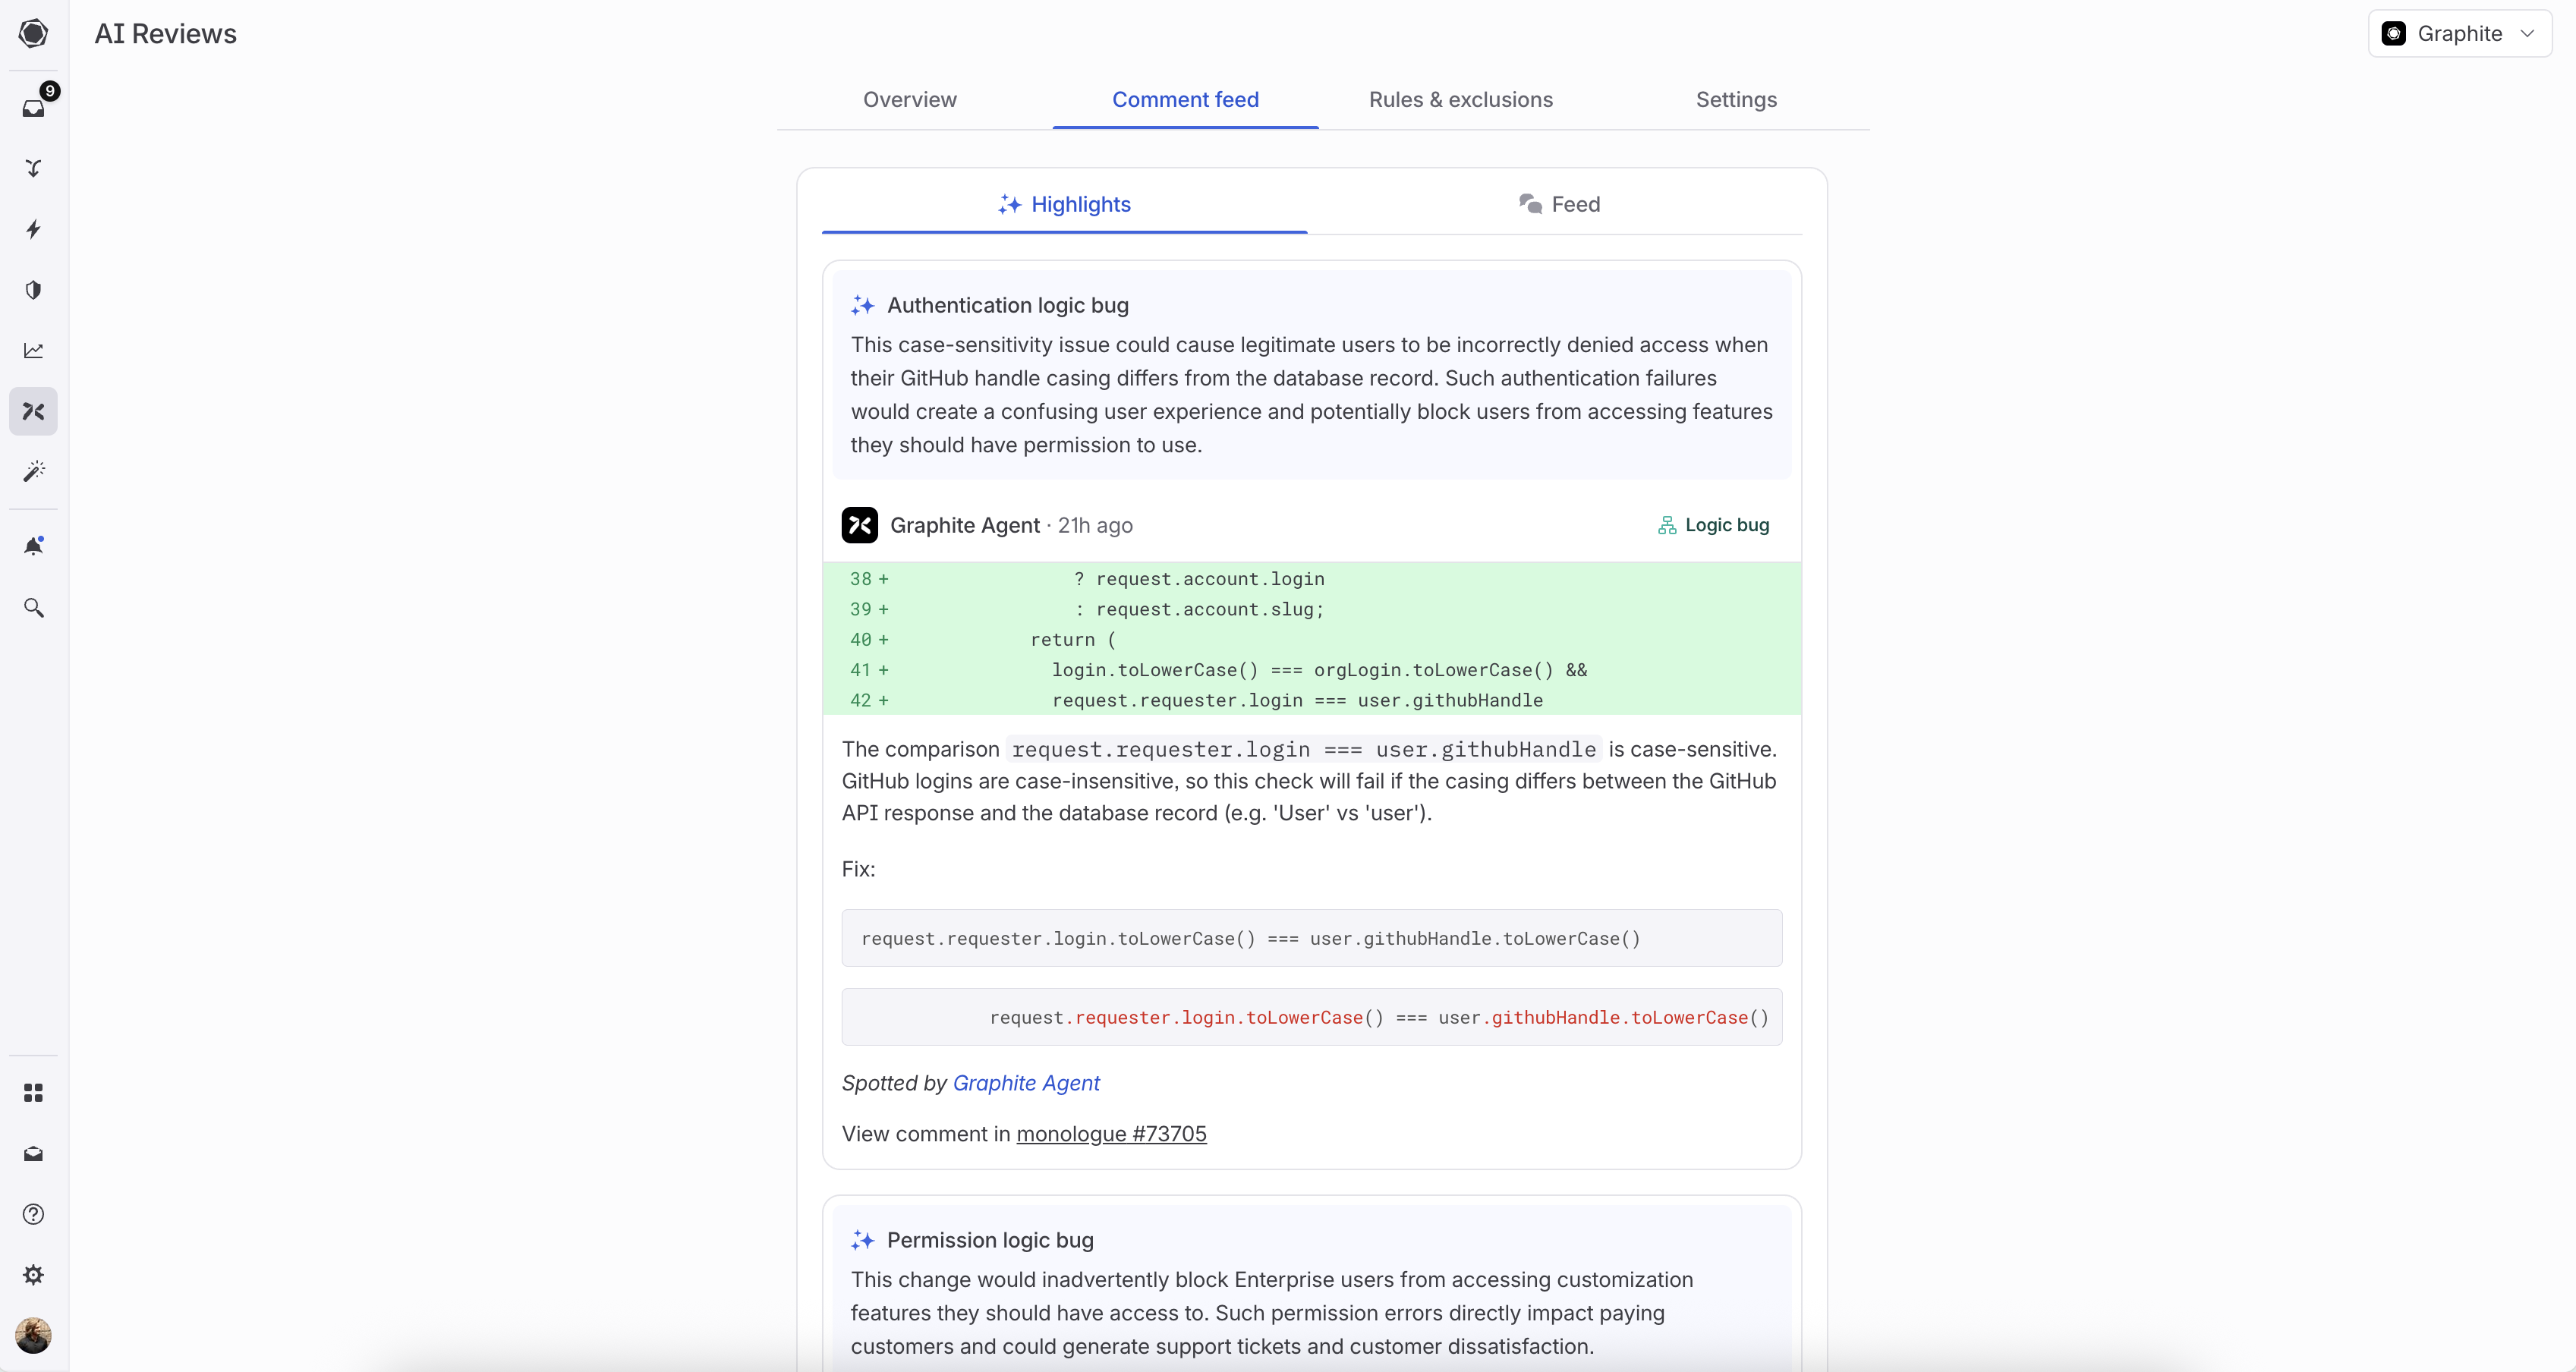
### Comment feed tab
The **Comment feed** tab lets you:
* View all comments Graphite Agent has left across your repositories
* Filter by category to focus on specific types of issues
* See prevented bugs and their potential impact
* Review code snippets with inline explanations
* **Issues found**: Total issues identified, with a breakdown by category
* **Issues accepted**: Number of issues that led to code changes
* **Acceptance rate**: Percentage of suggestions that were accepted over time
* **PRs reviewed**: Volume of pull requests analyzed
* **Downvote rate**: Feedback tracking to identify areas for improvement
You can filter these metrics by:
* **Time period**: Last 4 weeks, 8 weeks, 12 weeks, or all time
* **Repository**: View metrics for specific repositories or across all repos
The category breakdown shows counts and acceptance rates for each issue type (logic bugs, security issues, edge cases, etc.), helping you understand where your reviewer adds the most value.
### Comment feed tab
The **Comment feed** tab lets you:
* View all comments Graphite Agent has left across your repositories
* Filter by category to focus on specific types of issues
* See prevented bugs and their potential impact
* Review code snippets with inline explanations
 ### Rules & exclusions tab
The **Rules & exclusions** tab shows detailed analytics for your custom rules and exclusions. See [Measuring rule and exclusion effectiveness](/ai-review-customization#measuring-rule-and-exclusion-effectiveness) for more details.
## How to check AI review status
For any pull request, you can see the AI review status in the right-hand panel of the PR page:
### Rules & exclusions tab
The **Rules & exclusions** tab shows detailed analytics for your custom rules and exclusions. See [Measuring rule and exclusion effectiveness](/ai-review-customization#measuring-rule-and-exclusion-effectiveness) for more details.
## How to check AI review status
For any pull request, you can see the AI review status in the right-hand panel of the PR page:
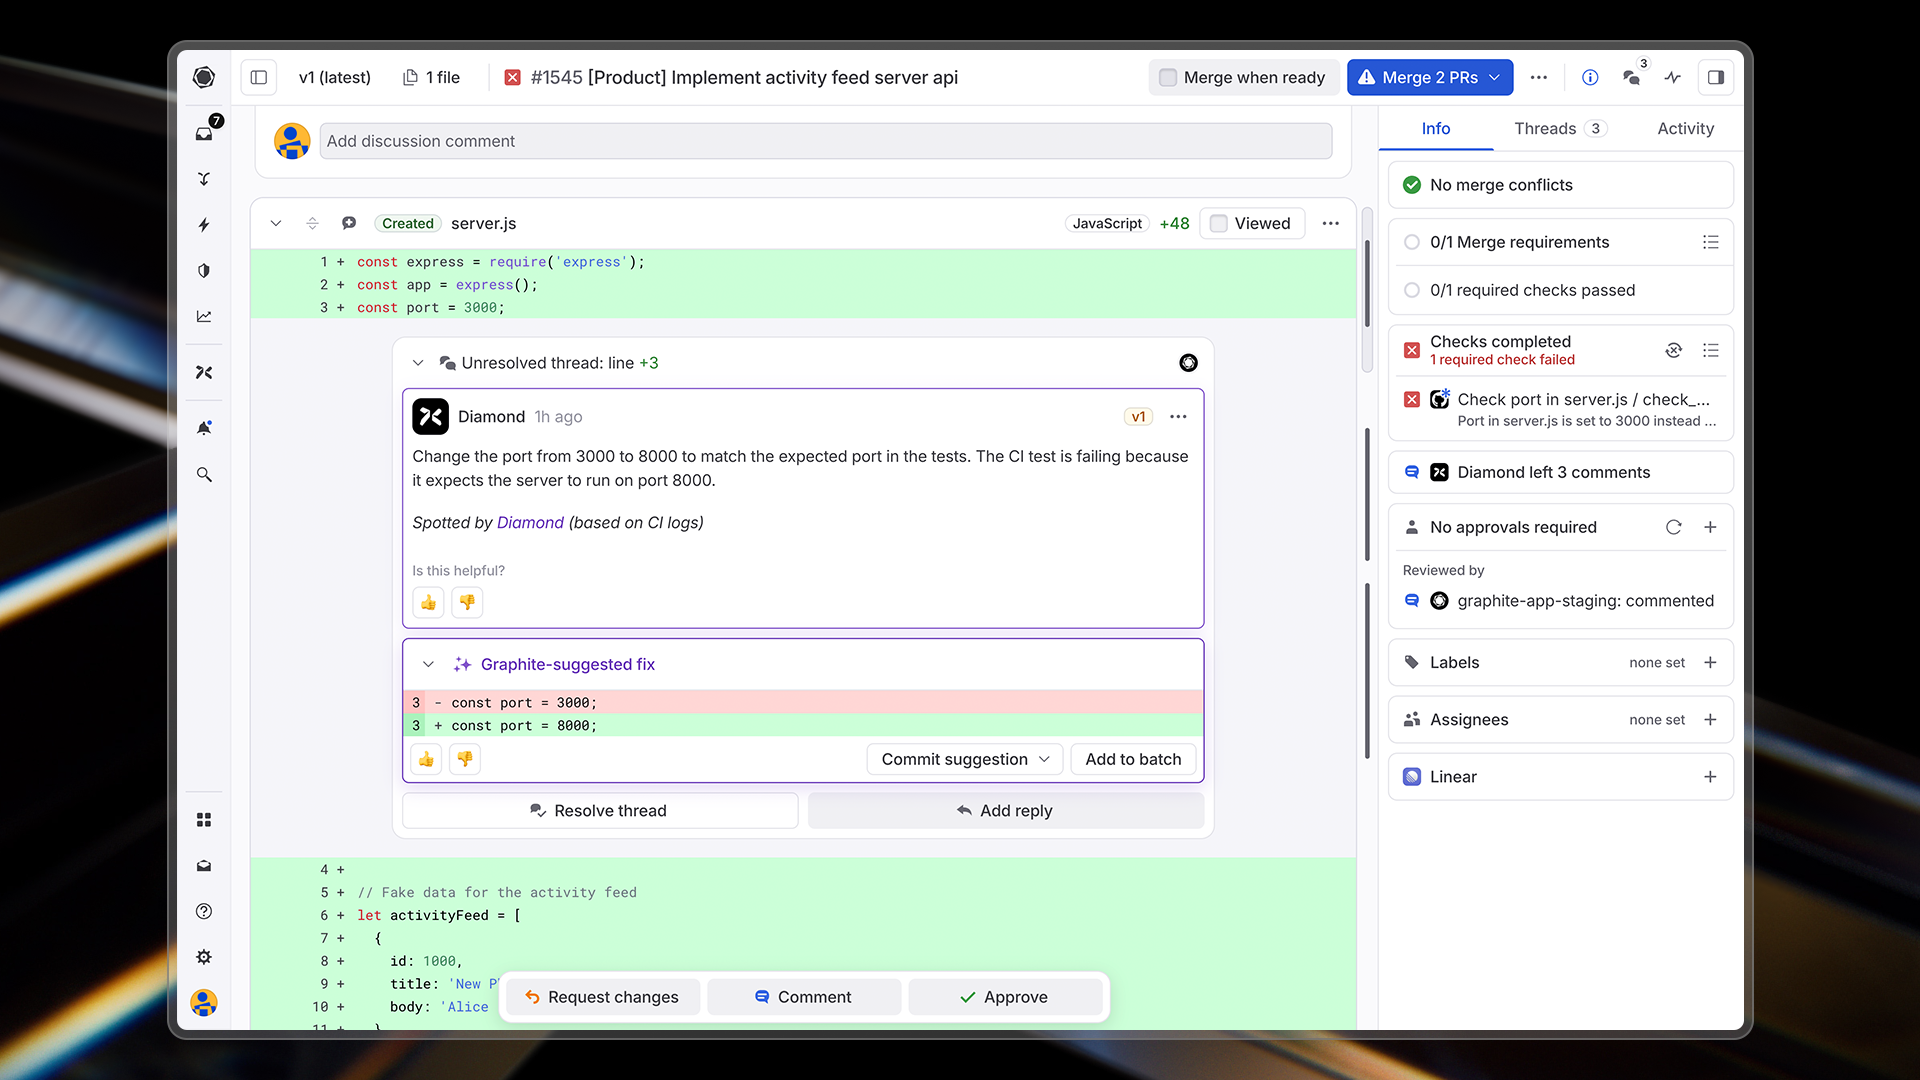 The status will show as:
* **Running**: Graphite Agent is currently analyzing the PR
* **Completed**: Graphite Agent has finished reviewing and left any relevant comments
* **Not running**: The PR won't be analyzed (e.g., if the PR exceeds 200,000 characters)
The status will show as:
* **Running**: Graphite Agent is currently analyzing the PR
* **Completed**: Graphite Agent has finished reviewing and left any relevant comments
* **Not running**: The PR won't be analyzed (e.g., if the PR exceeds 200,000 characters)